


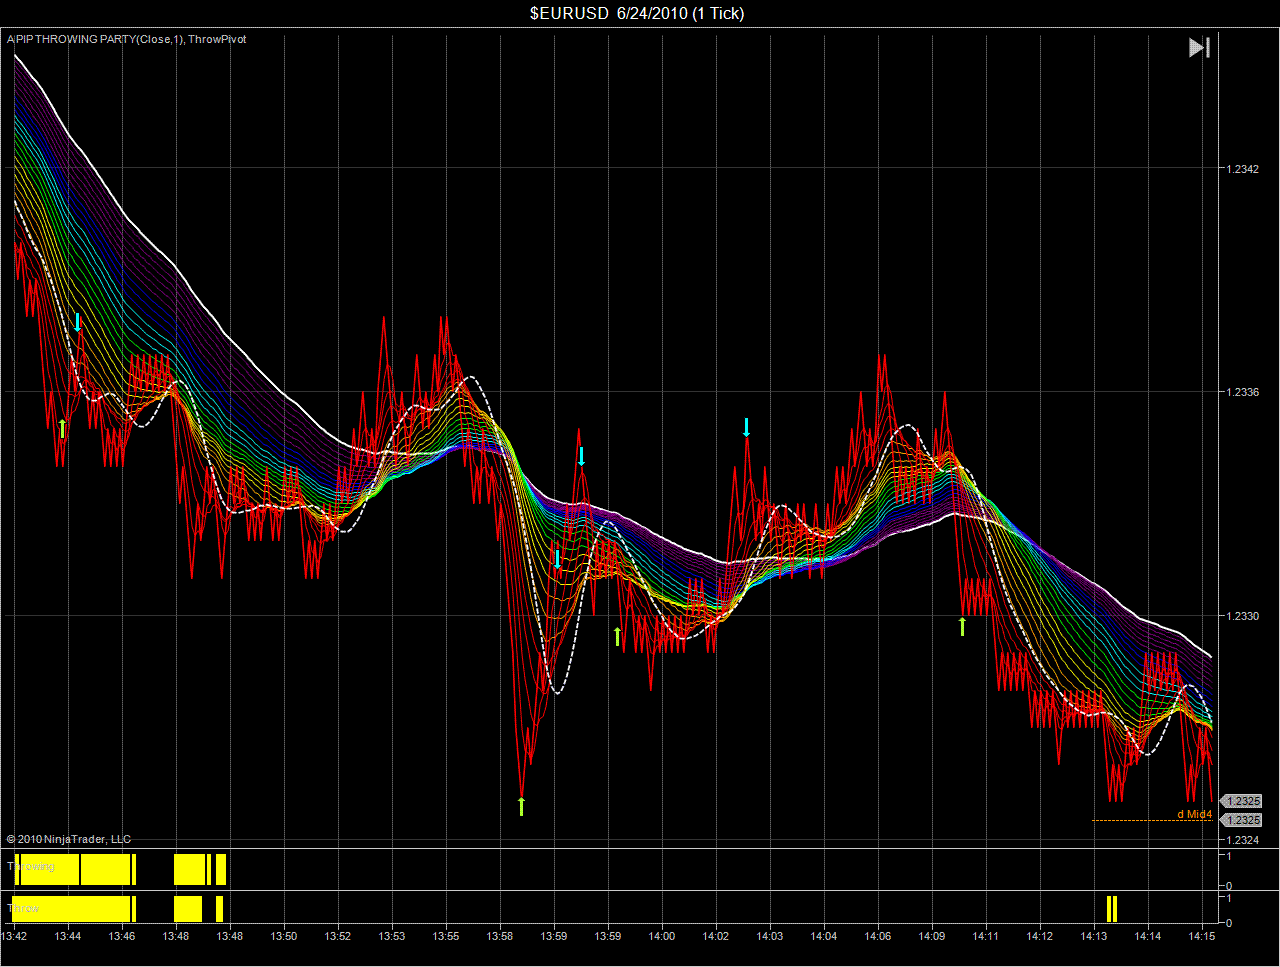
Here is the 5min charts, arrows mark the entries and what i was looking at.
8-price was dropping, getting OS yellow had the weekly pivot at 35 +2.5
9-price continued moving down my next rest. area is 25, price stretched i was waiting exited +5
10-price pushed up to the Weekly Pivot again and I shorted into this down move +5
11-same trade, went a little against me be I felt based on the 5min chart we were in a bit of a down move.
12-got yellow of the rest again bought +3
13-shorted into the down move off the exit of trade 12 +4
14-bought again at the bottom here +5
15-shorted again into the down move off the exit, went a couple against me exited again at the rest. +4
16-bought off the exit at the rest again and exited at the same place as before +4
17-and shorted into the down move +4
18-yellow buy +3
19-same exact trade


.gif)


.gif)

.gif)


.gif)
.gif)